How to create a Sociogram
A sociogram is a diagram of interpersonal relationships within a group. In this tutorial we will create a sociogram depicting the relationships within an elementary school class. The outcome will be a visualization of the roles that individuals hold within the group.

Teachers use sociograms to gain a deeper understanding of their student’s relationships within the class.
A case study of elementary school, grade 3
The following scenario is from “Share this with all the schools, please”:
Every Friday afternoon Chase’s teacher asks her students to take out a piece of paper and write down the names of four children with whom they’d like to sit the following week. The children know that these requests may or may not be honored. She also asks the students to nominate one student whom they believe has been an exceptional classroom citizen that week. All ballots are privately submitted to her. And every single Friday afternoon, after the students go home, Chase’s teacher takes out those slips of paper, places them in front of her and studies them. She looks for patterns.
Let’s create a new group and a new diagram to capture this case study. Click the (+Diagram) to create a new diagram. Edit the title to be “Sociogram of Grade 3”
Now we are ready to enter the written answers provided by the students. The students provided the following data:
Table A: Student seating preferences
| Student | Preferences |
|---|---|
| Abigail | Amy, Rachelle, Sophia |
| Alex | Daniel, Joel, Mason |
| Amy | Abigail, Emma, Lily |
| Charlotte | Claire, Emily, Olivia |
| Claire | Charlotte, Emily, Olivia |
| Daniel | Jayden, Mason, Sophia |
| Emily | Joel, Mia, William |
| Emma | Abigail, Amy, Sophia |
| Isabella | Emily, Madison, Mia |
| Jayden | Matt, Rhys |
| Joel | Alex, Emily, Isabella |
| Liam | Matt, William |
| Lily | Amy, Rachelle, Sophia |
| Madison | Emily, Isabella, William |
| Mason | Alex, Daniel, Toby |
| Matt | Jayden, Liam, William |
| Mia | Claire, Emily, Olivia |
| Michael | Abigail, Mason, William |
| Noah | Matt, William |
| Olivia | Charlotte, Claire, Mia |
| Rachelle | Abigail, Emma, Sophia |
| Rhys | Liam, Matt, William |
| Sophia | Abigail, Emma, Rachelle |
| Toby | Alex, Joel, Mason |
| William | Emily, Matt, Noah |
Seeing as there is quite a lot of data, we will enter this data into the table view. The view select menu is in the toolbar in the top right corner. Select the table view.
To add a name, type it in the first box at the top of the entry table, and press the enter key.
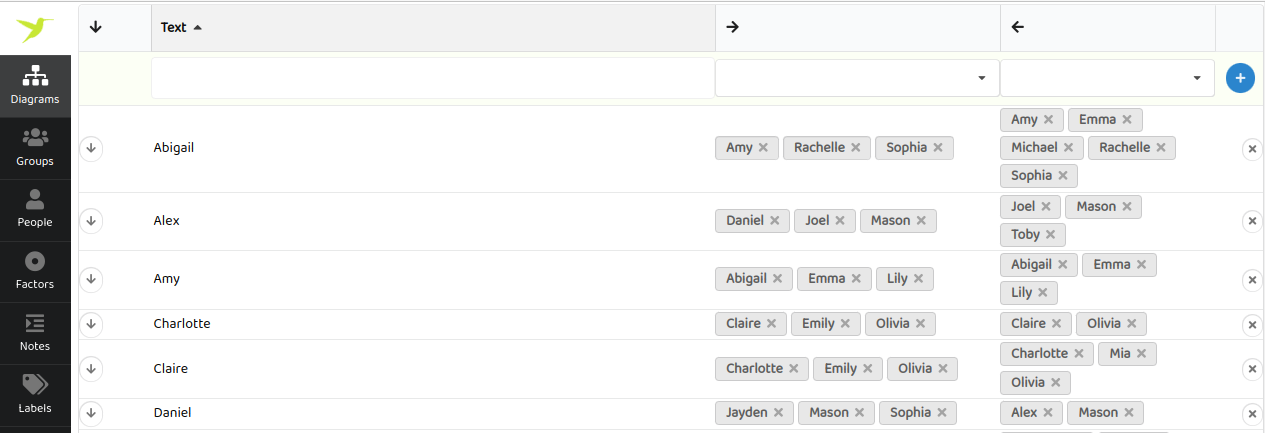
In this case we can add the people and their connections in one step. Type the name in the first box at the top of the entry table, then press the tab key (or use the mouse to select the next field), and type in the name of the person to connect to. This way we can work through the data faster. If you make a mistake or need to add another connection, scroll down a bit to find the row and edit it there.
Figure1: Entering data for grade 3 sociogram

Notice that as well as showing the nominated preferences under the column labeled with a right arrow (→) we can now see the preferences received under the column labeled with a left arrow (←). We can sort by the number of preferences received by clicking on the left arrow (←) heading. This shows us who received the most and least preference nominations.
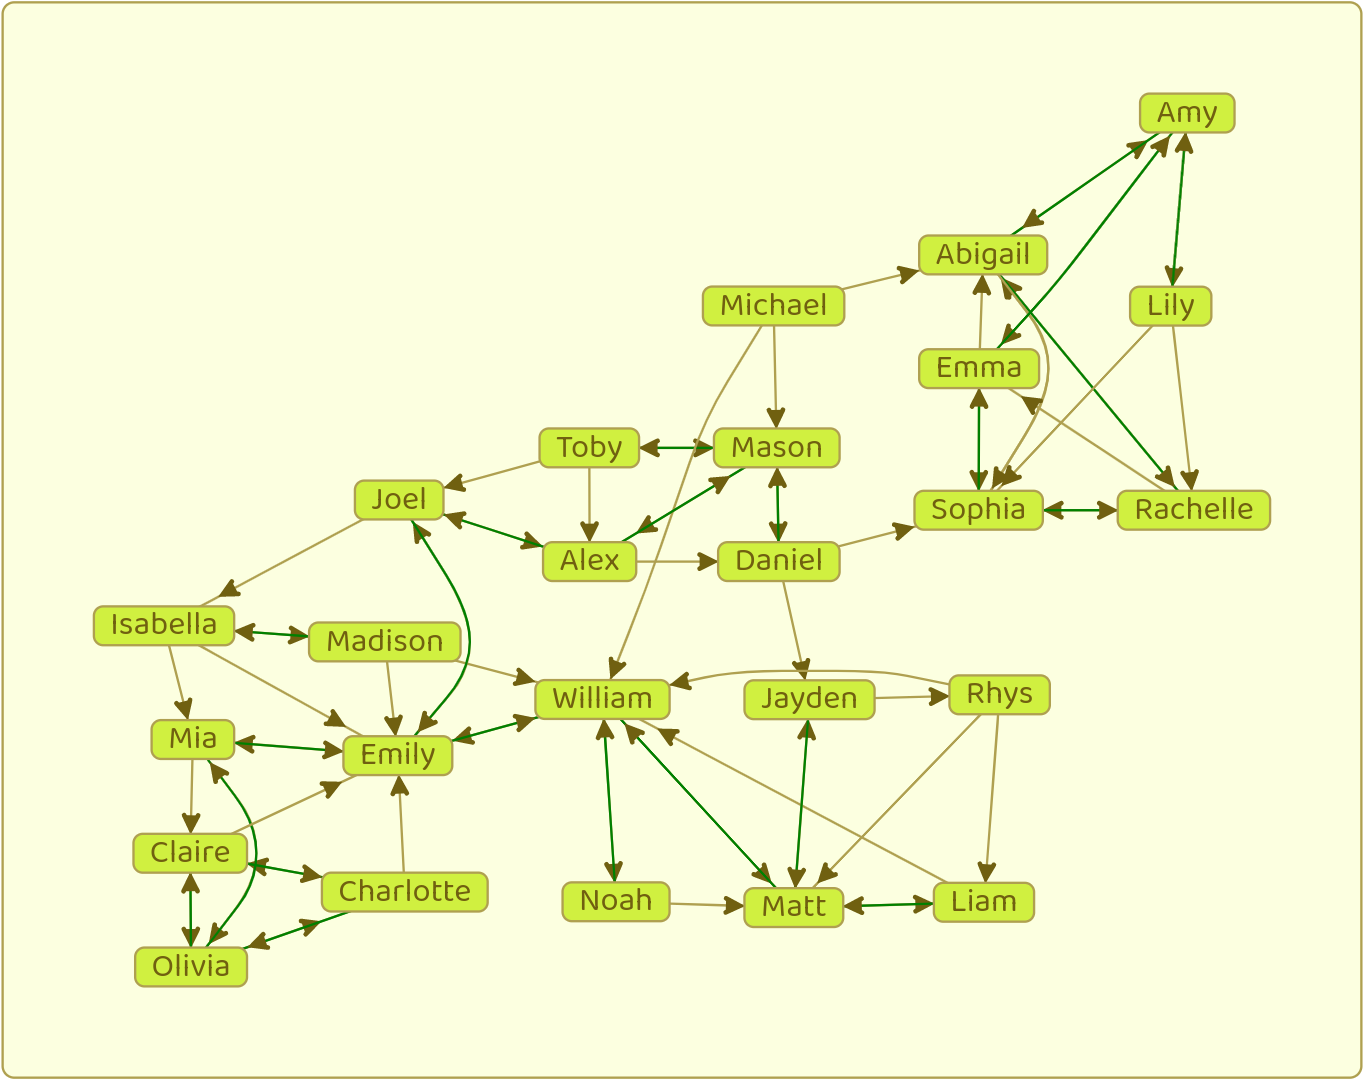
Once we have entered in all the names and their nominations, we can return to the main diagram view. Select diagram view from the view select menu is in the toolbar in the top right corner. We see something like this:
Figure2: Sociogram of grade 3

The arrows point to nominations.
We notice several things about this class:
- The group contains a tight subgroup of 6 girls on the right hand side of the sociogram, with no links out to the rest of the group.
- Michael is isolated, with no nominations at all.
- Emily and William occupy central roles and bridge subgroups.
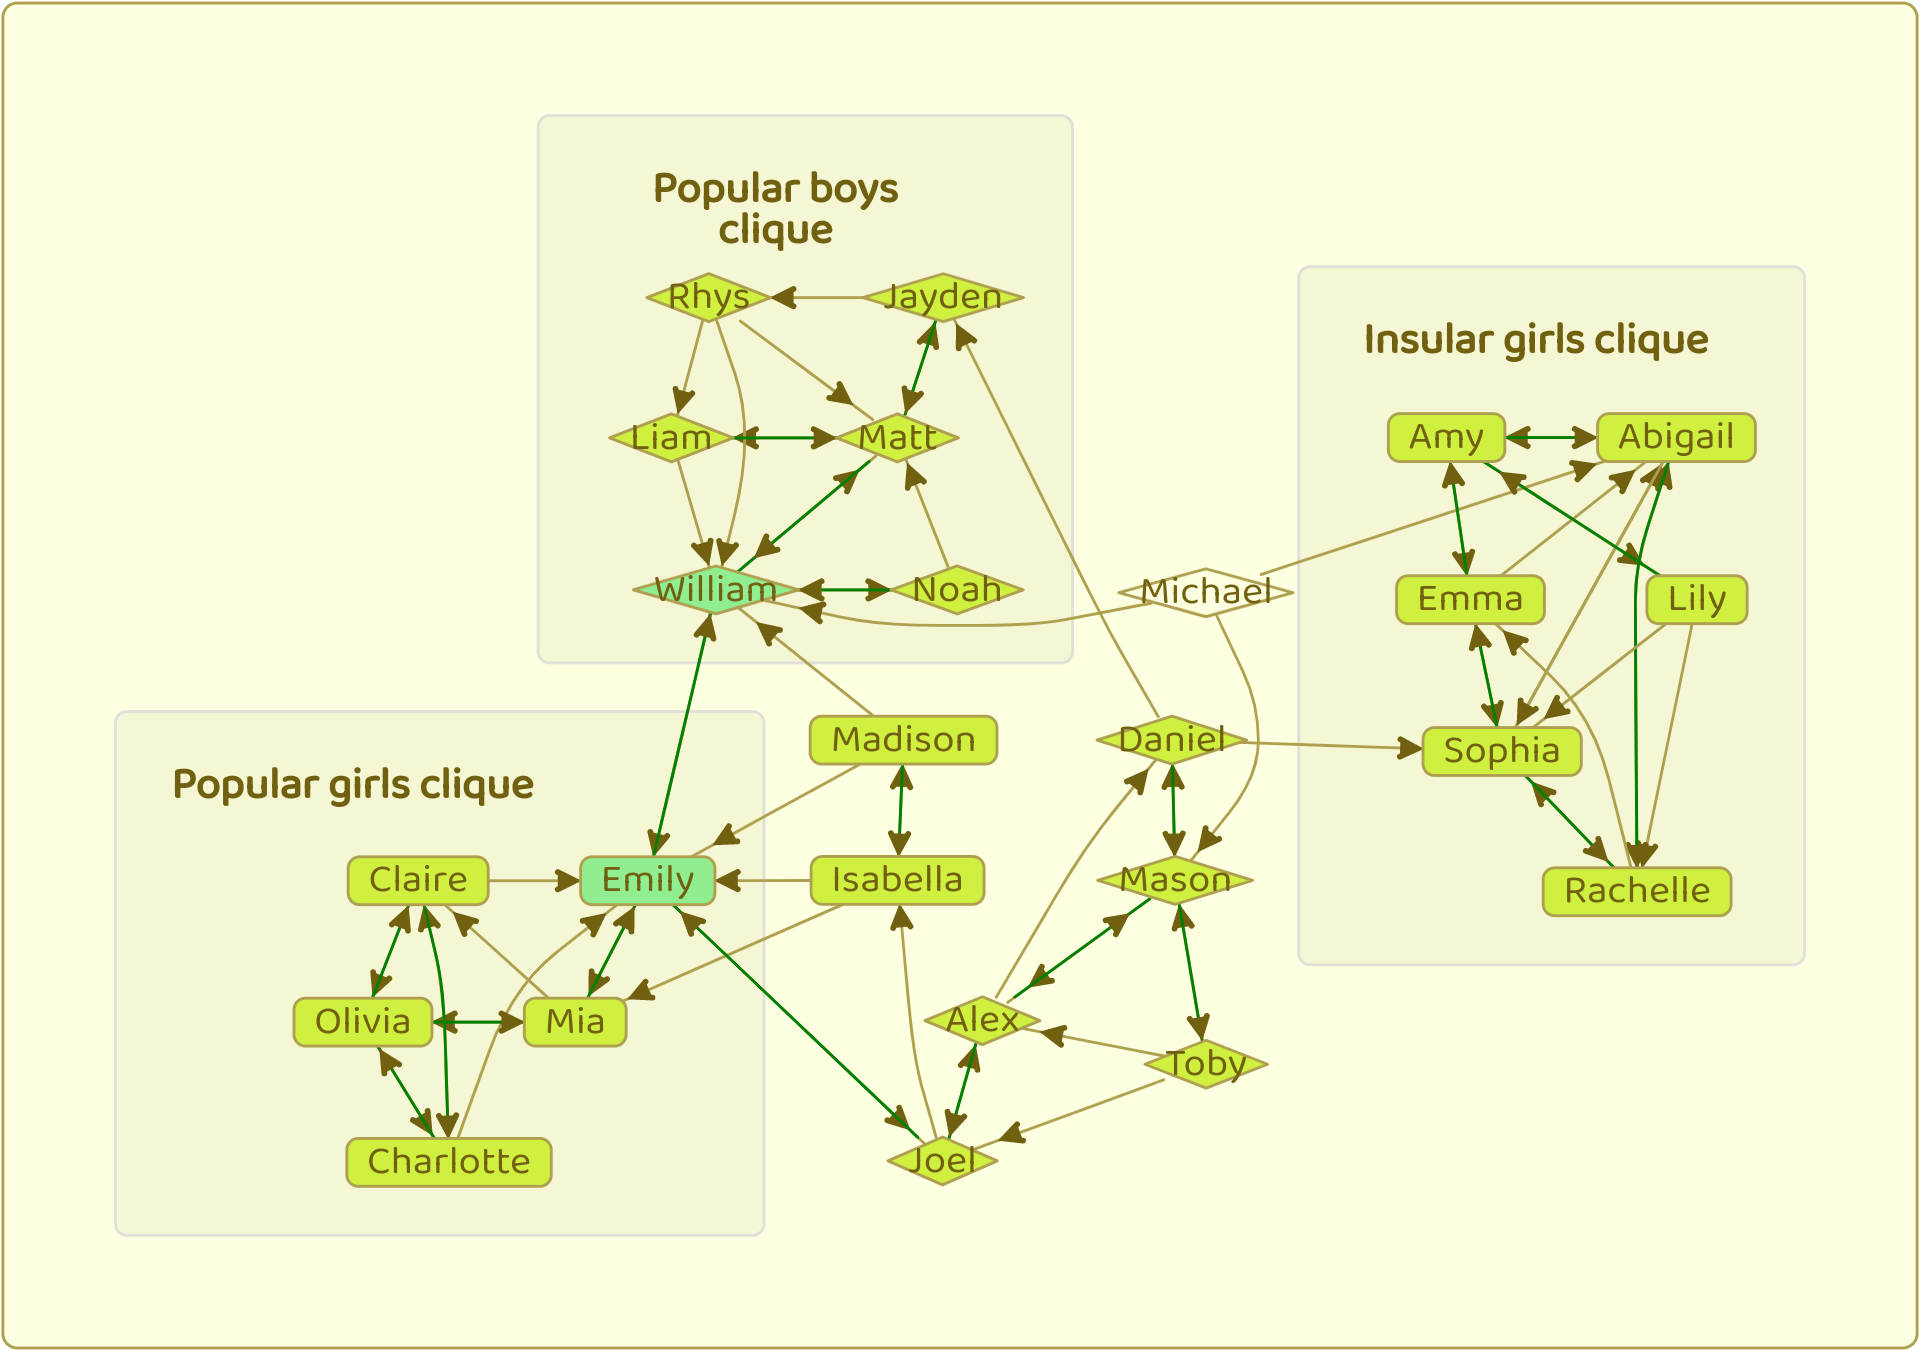
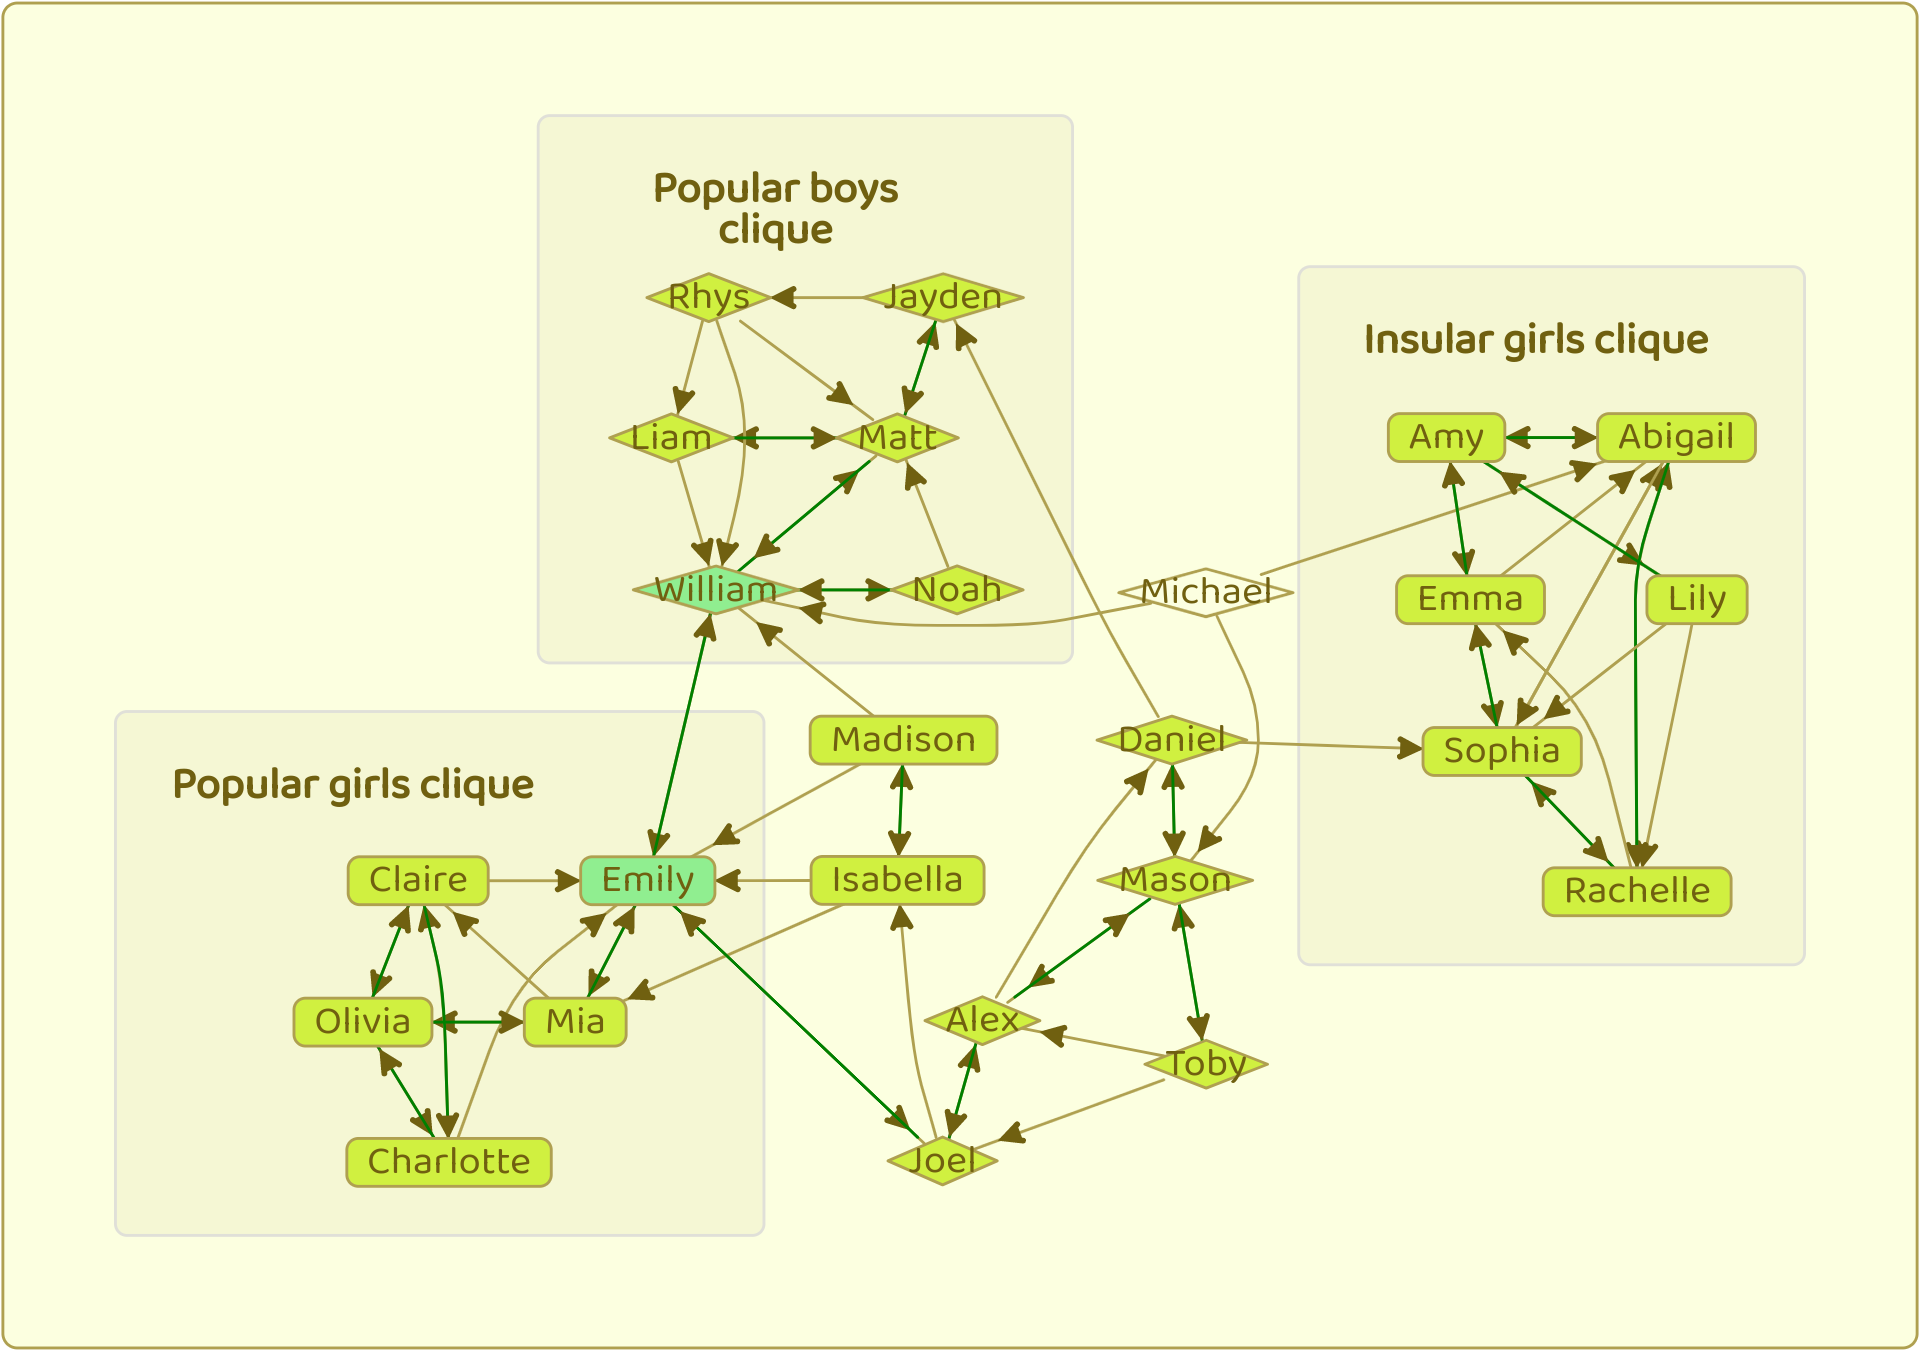
We can make the sociogram more informative by changing the shape of all the boys to a diamond. To do so, click on the boy names in the diagram, then click on the shape button. We can color Emily and William green by selecting them and clicking on the color button. If we have additional information about the relationships, we can click on the links to change their color, line or label.
To highlight the subgroups, we can put a box around them. Select the subgroup by dragging an area around them, or shift clicking the members individually. Create the subgroup by clicking the (Group) button that appears. The resulting sociogram highlights the information more clearly.
Figure3: Sociogram of cliques in grade 3

Methodology
Sociograms were first used by Moreno (1934), who developed sociometry as a research and therapeutic technique. A sociometric measure assesses the attractions or repulsions within a given group based upon the assessment of social choices. The metric is measured by asking all group members to identify persons they would prefer or would not prefer to have as partners in a given activity.
- Choose a metric of interest to assess
- Choose group, groups, or sets of subjects to assess
- Present the participants with a question that measures the metric
- Collect, visualize and analyse the data
- Repeat periodicity where appropriate
Many variations can be made by the choice of question or group selection. For example, a group structure can be exposed through recording interactions between group members. When framed with appropriate questions and groups, sociometric status can be a measure of leadership, social adjustment, prejudice, and competency. The technique can also be applied on larger scale by treating organizations as units.
Conclusion
We created a sociogram depicting the group dynamics of a grade 3 elementary school class. The result was a visualization of the structure of the group. We were able to identify central and isolated students, and observe some cliques.
References
Share this with all the schools, please - Glennon Doyle Melton (2014)
Who shall survive - Jacob Levy Moreno (1934)
