
How to create an Interactive Factors Framework diagram
An IFF diagram displays a problem identified together with relevant aspects of the problem situation. In this tutorial we will create a diagram and build some hypotheses to help a student with learning difficulties. The outcome will be a pictorial representation of the evidenced or presumed factors involved.
Psychologists and teachers use the Interactive Factors Framework (IFF) in problem analysis to map causes and generate hypotheses about emerging behaviors and responses to intervention. The hypotheses are shown via arrows indicating the connections between the behavioral, cognitive, affective, environmental, and biological factors. IFF diagrams may also include the expected effects of suggested interventions.
A case study of Janet
The following scenario is from “Special educational needs, inclusion and diversity”:
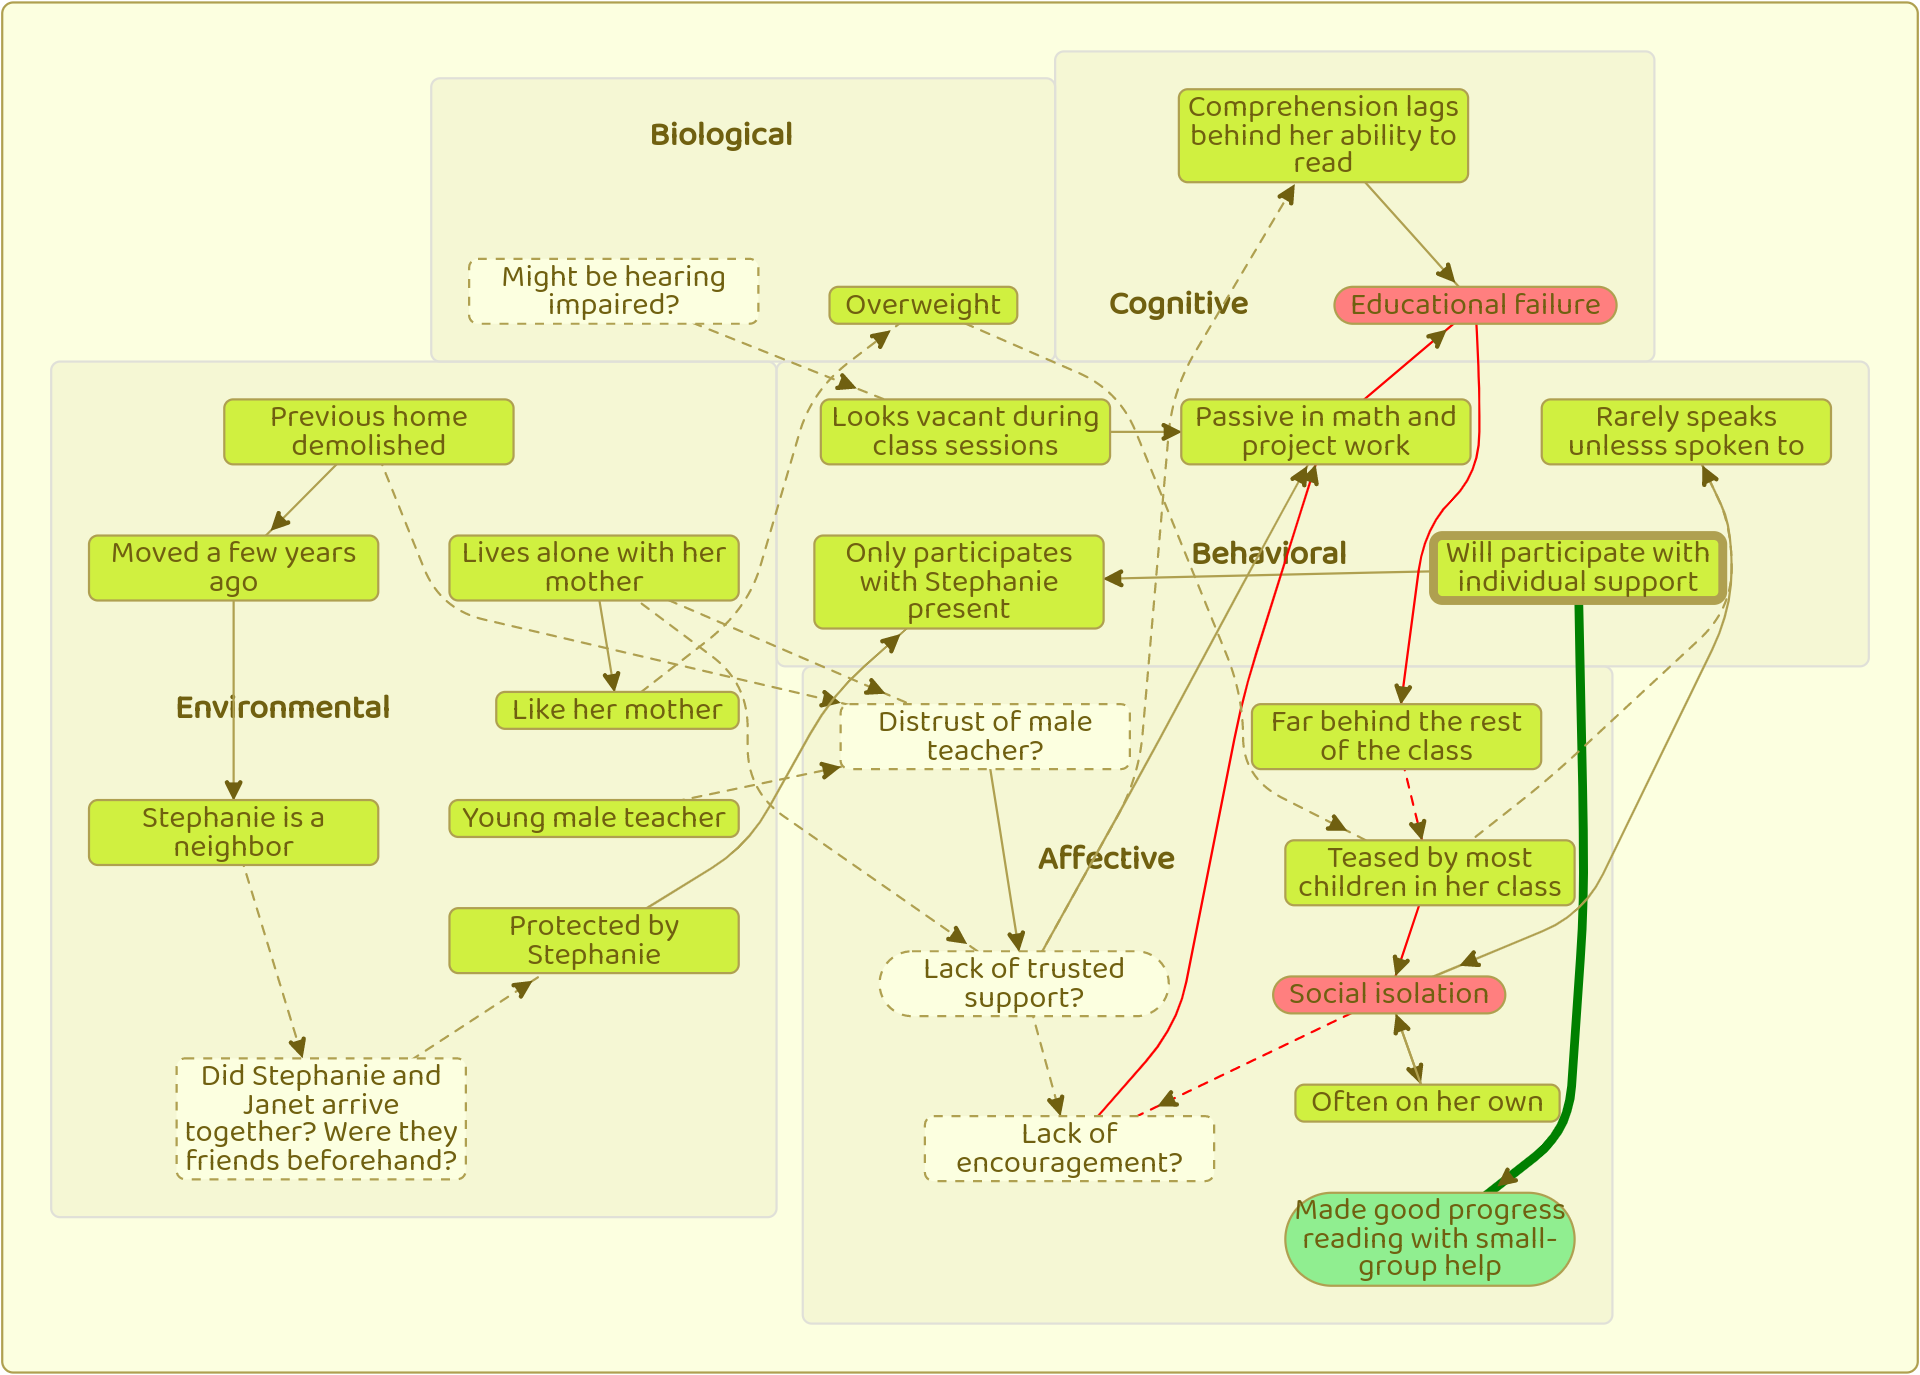
Janet, who is 10 years old, lives alone with her unemployed mother. They moved a few years ago into a decaying post-war estate on the edge of a small industrial town in the North-East of England. A group of families arrived there together, rehoused from one street in Newcastle when it was demolished for redevelopment.
Janet, like her mother, appears overweight, slow-moving and slow-thinking. There is a question mark about her hearing, as she often seems to look vacant during whole-class sessions in school. But her mother has failed appointments for hearing tests. In the Year 6 classroom Janet rarely speaks unless spoken to. She is teased by most children in her class but protected by a small, lively group of girls whose streetwise leader, Stephanie, is the daughter of a neighbour. In the company of this group, when Stephanie is present, Janet will participate clumsily in playground skipping games and suchlike. But if Stephanie is absent (which is not uncommon), she will often be on her own in the playground.
She made good progress in reading with small-group help during Year 5, though her comprehension lags behind her ability to decode print and read aloud. At this stage most of her attainments are far behind the rest of the class. In maths and in any kind of project work she will sit passively and achieve very little output. Her teacher, an energetic and committed young man, pronounces himself at a loss as to how to break into what he sees as a cycle of self-reinforcing educational failure and increasing social isolation.
Let’s create a new diagram to capture the case study, click the (+Diagram) button in the navigation bar to create a new diagram. Edit the title to be “IFF diagram of Janet”.
We can either enter new factors in the quick add box at the top of the screen, or from the table view. It will be easiest to use the table view initially because we will be adding a long list of factors based on the text. To access the table view use the view select button which appears in the top right toolbar at the right end.
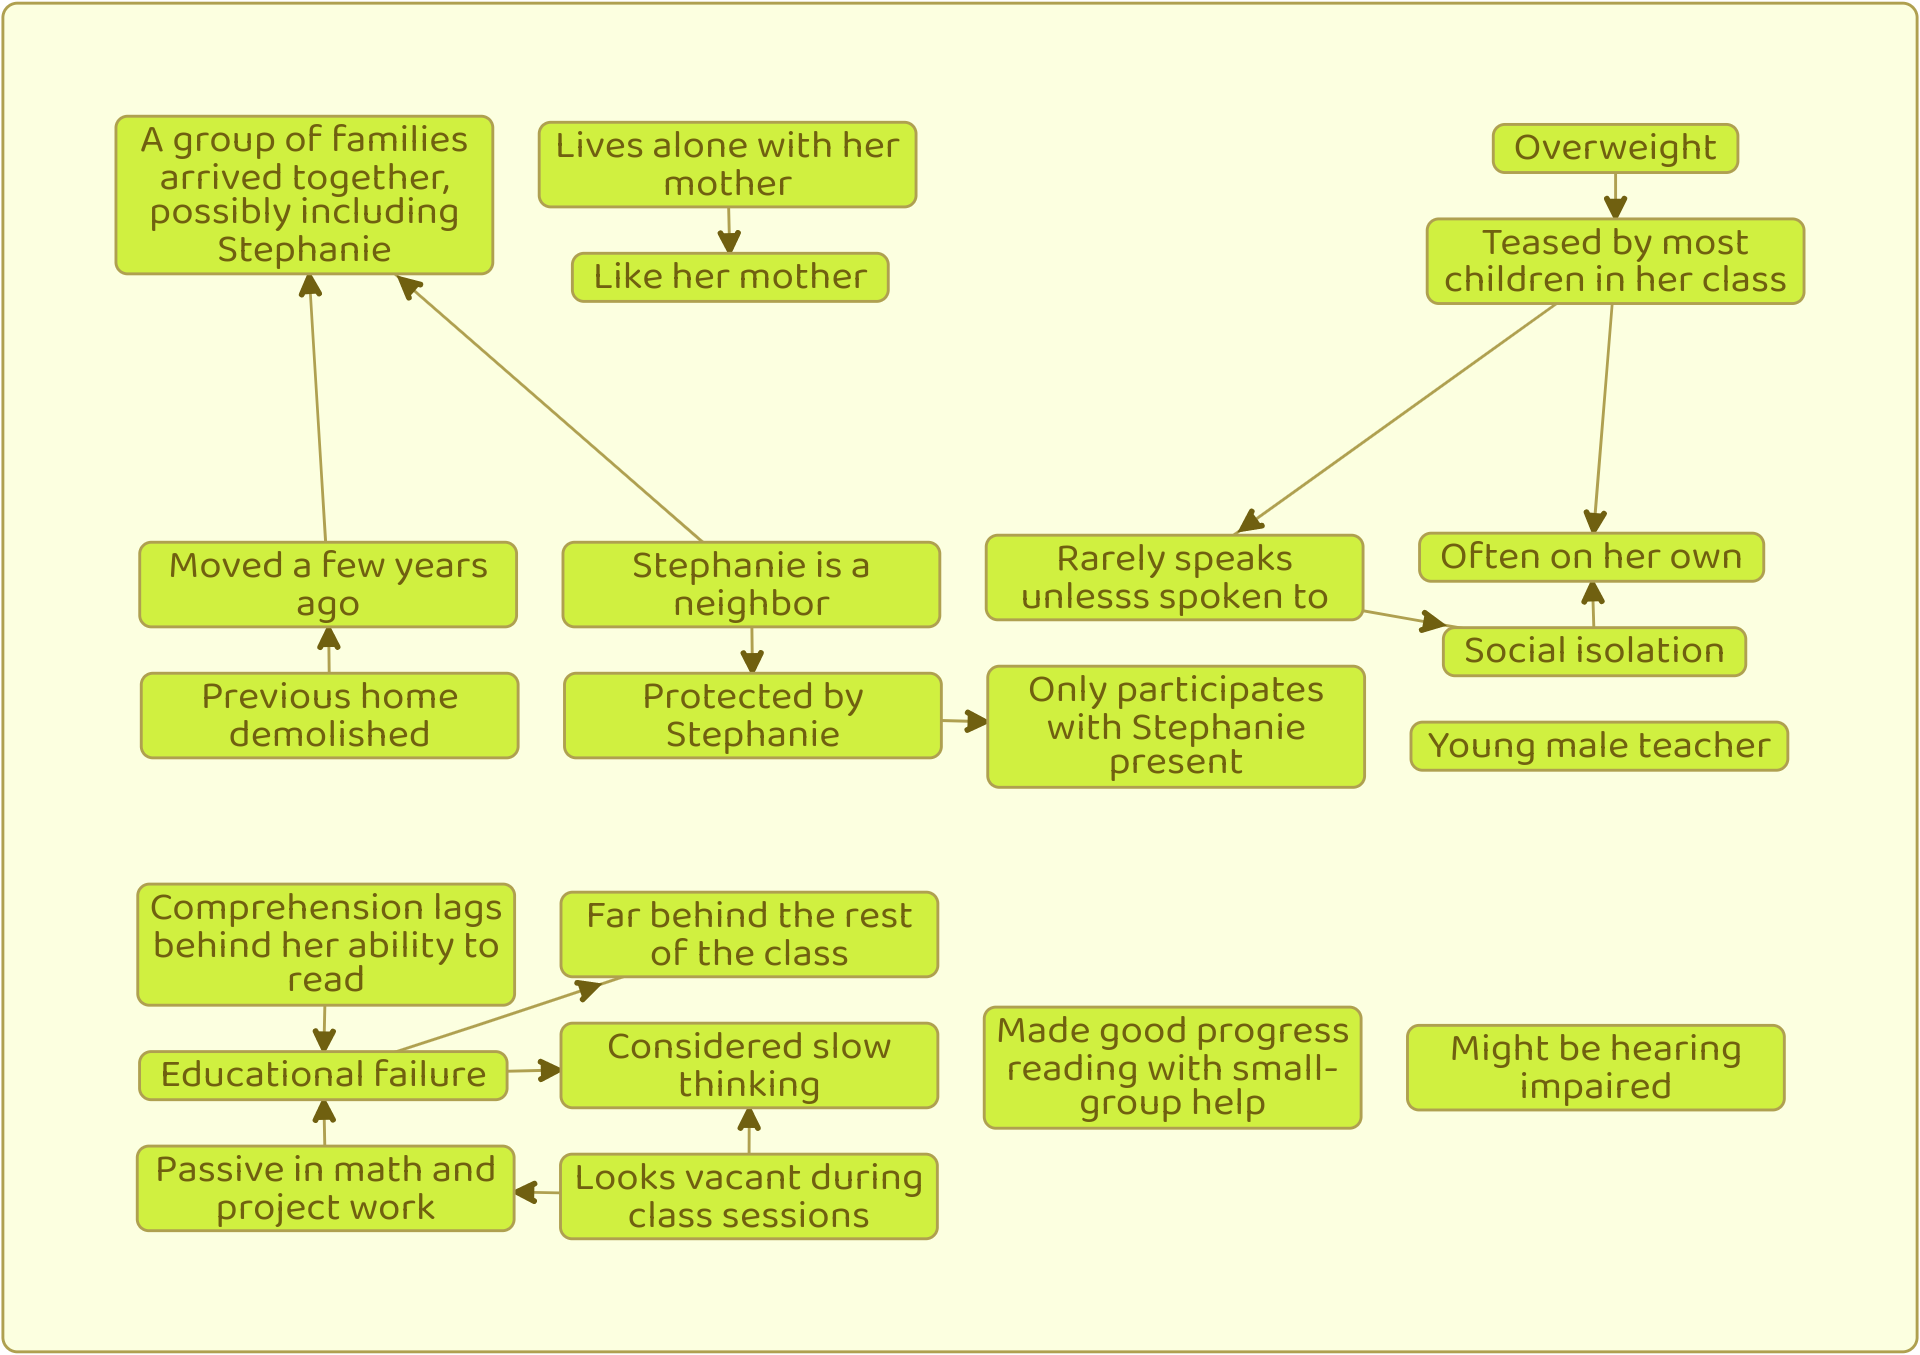
We break the description up into factors as such:
- Lives alone with her mother
- Moved a few years ago
- Previous home demolished
- Overweight
- Considered slow thinking
- Like her mother
- Might be hearing impaired
- Looks vacant during class sessions
- Rarely speaks unless spoken to
- Teased by most children in her class
- Protected by Stephanie
- Stephanie is a neighbor
- A group of families arrived together, possibly including Stephanie
- Only participates with Stephanie present
- Often on her own
- Comprehension lags behind her ability to read
- Made good progress reading with small-group help
- Far behind the rest of the class
- Passive in math and project work
- Young male teacher
- Educational failure
- Social isolation
Our focus is initially on #21 and #22. Now it’s time to start looking for causal relationships. It appears that “Passive in math and project work” #19 is causing “Educational failure” #21, and that #21 is causing “Far behind the rest of the class” #18.
Figure 1: Entering factors into the table view and connecting them
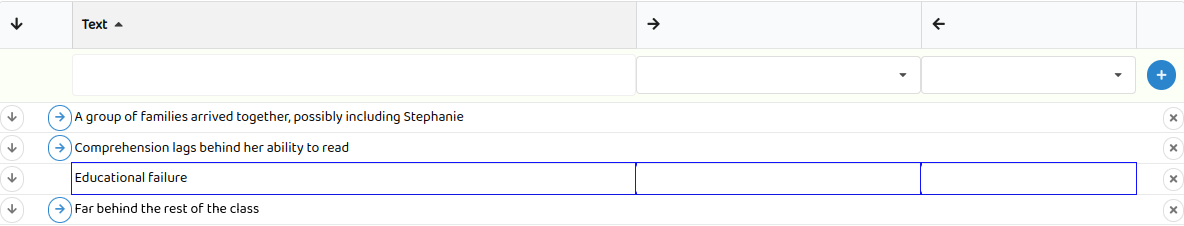
We can make these connections in the table view by clicking on the source factor to select it, then clicking on the blue connection arrow that appears next to the factor that the source causes. Alternatively, we can click in the second column titled with a → right-facing arrow and search for the factor to connect to by typing “Far behind”.
Let’s continue making more causal connections that we can observe in the table.
Figure 2: Initial causal diagram
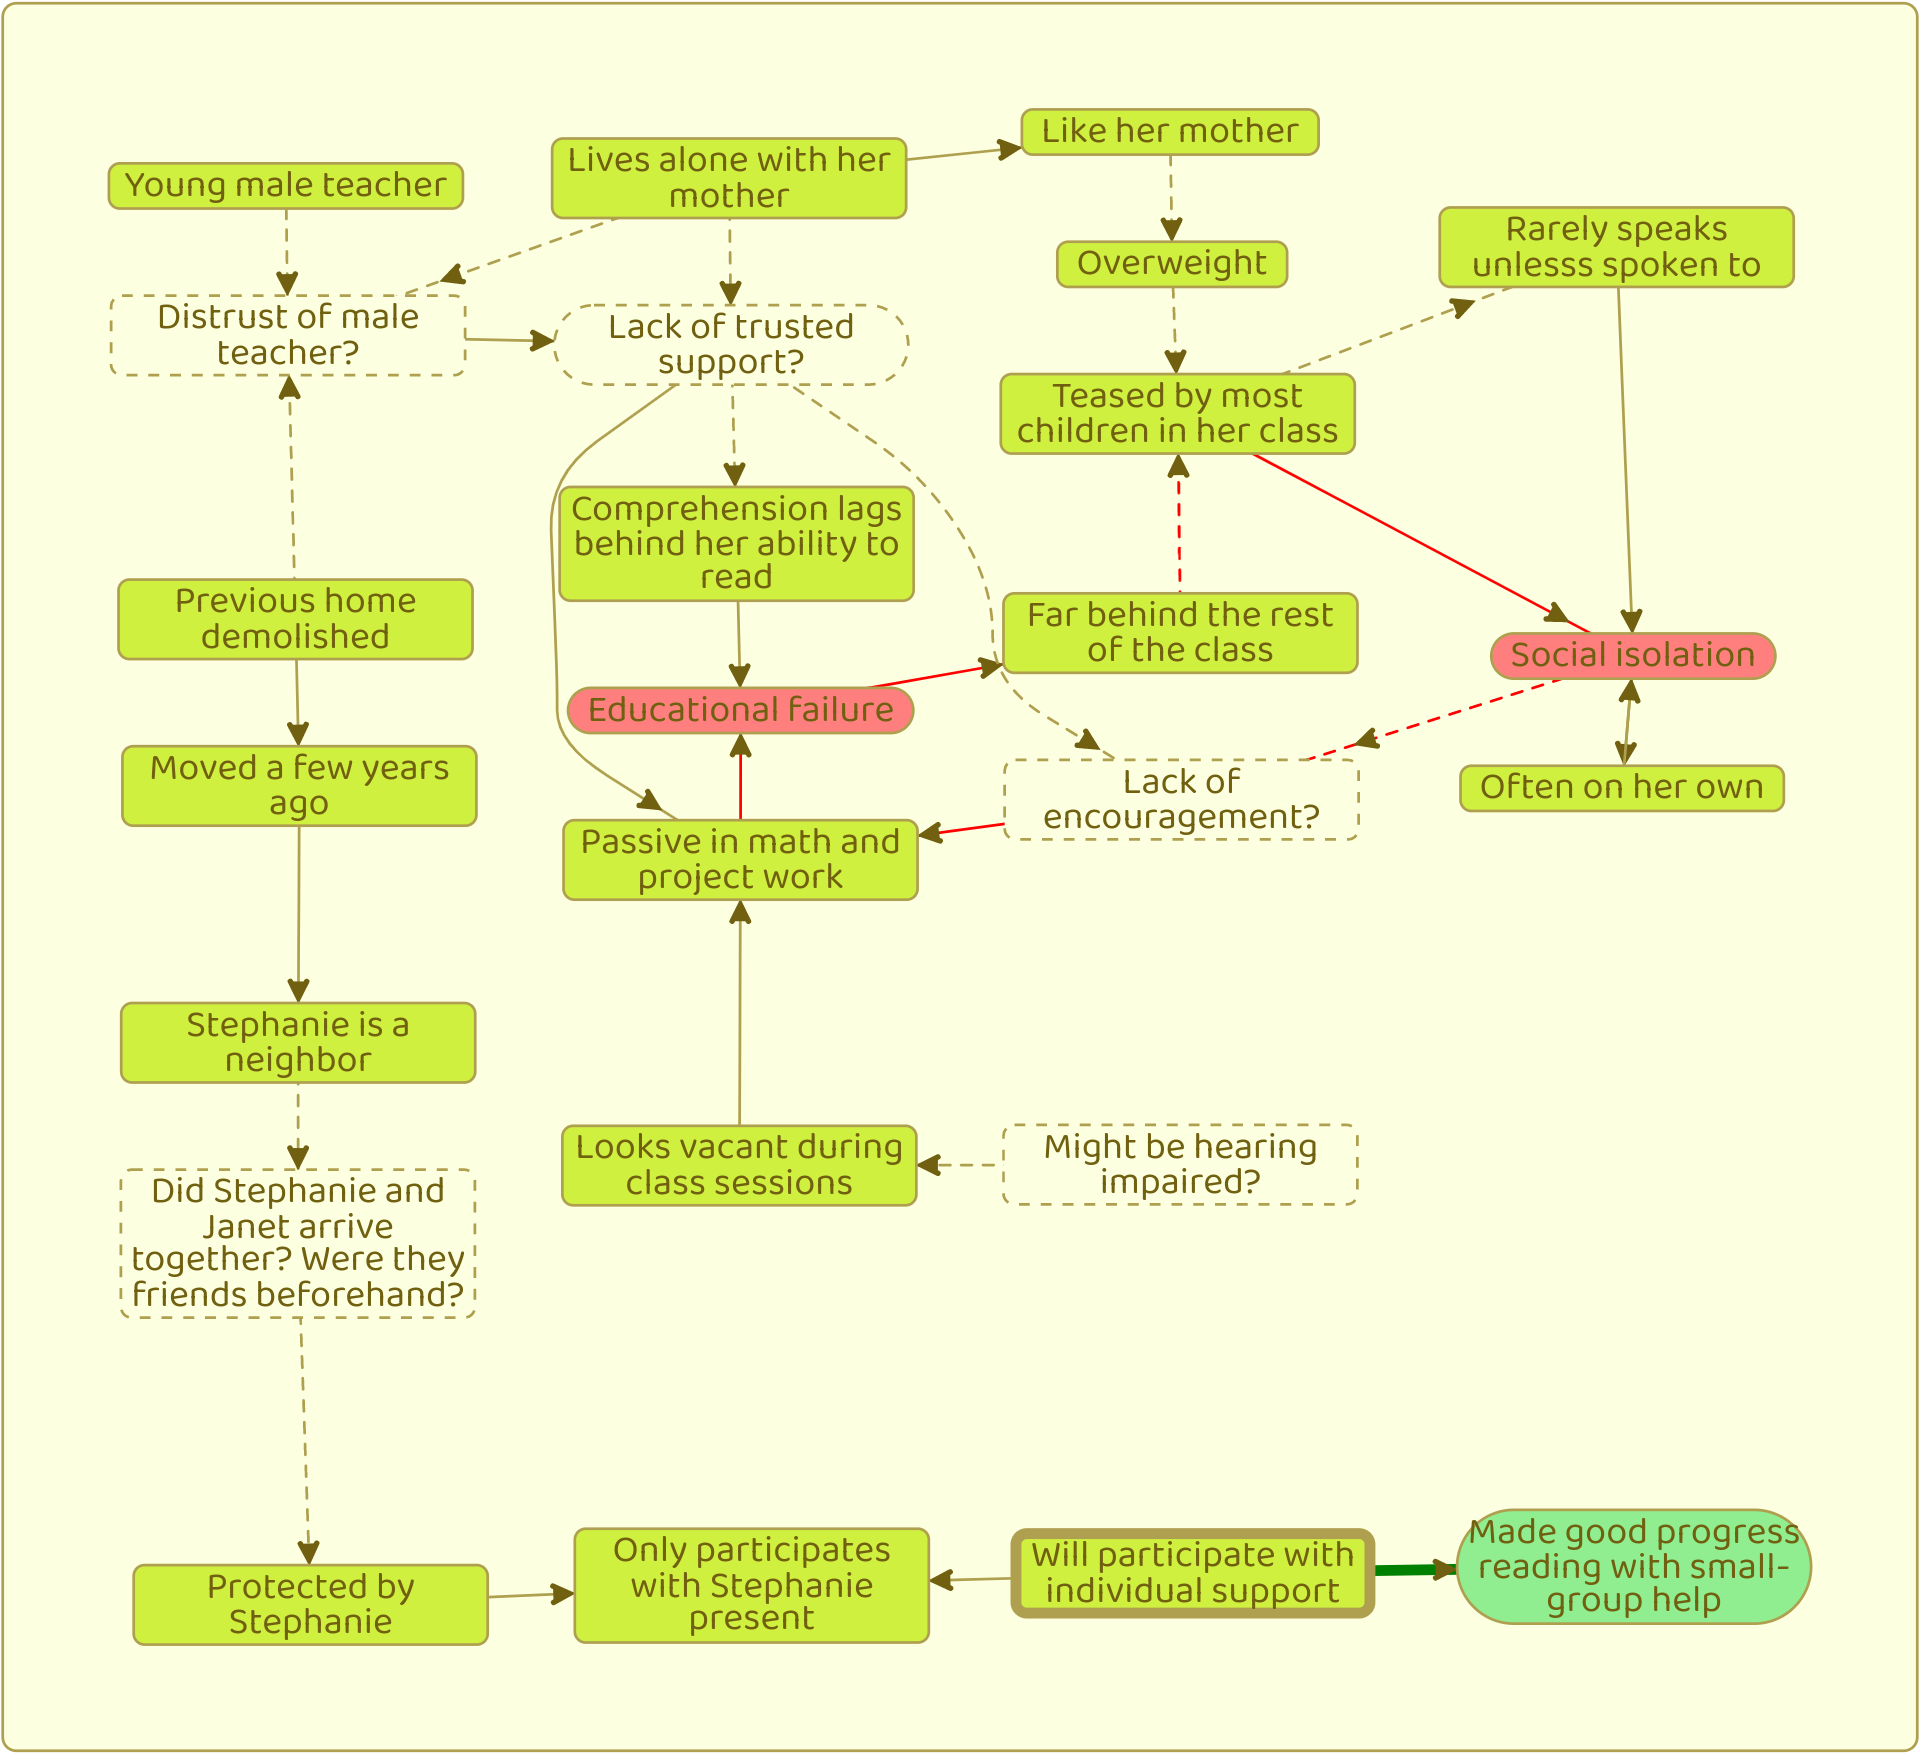
Some causes that we are connecting are only guesses. There isn’t any evidence that being overweight is causing other children to tease Janet. We also guessed that Janet might have known Stephanie before moving. Differentiating causes with evidence from assumed causes will provide ideas for follow-up investigations. Let’s mark these as unknown by converting the links to dotted lines. To do this, move the mouse over the link and click on the button labeled - (hyphen).
Next we can bring attention to the focal concerns by changing their shape and background color. When we place the mouse over the focal factors, the circle button will change shape, and the paint drop button will change the background color. Let’s make the focal factors red and rounded.
It seems that Janet only has female role models in her life (her mother and Stephanie). It might be worth investigating whether there is an issue here that causes distrust of her male teacher. The destruction of her previous home surely had a serious impression, has that contributed to her keeping to herself? Could it be that some of her behavior is copied from her mother, given they are described to be so alike? Let’s add some of these factors with dashed outlines and no background to indicate more information would help.
There are also some positive factors to observe. Janet made good progress reading with small-group help. This is worthy of being a focal factor as we want to support positive outcomes. Let’s make that factor green and rounded. Janet will participate when supported, and there is evidence for this when Stephanie is present.
Figure 3: Including hypotheses for follow up
Now we have a more complete picture of the situation and can identify the important questions to answer:
- Can we break the red cycle of social isolation and educational failure by providing consistent encouragement?
- Why is Janet being teased? Can we provide coping strategies?
- Can individual or small group learning support be increased?
- Does Janet distrust her teacher? If so why?
- Is she hearing impaired or not?
So far we’ve been able to organize our thinking about the problem, map out how these factors are related, and come up with some ideas about what might be going on. Let’s transition now to looking in more depth at what the Interactive Factors Framework is.
Methodology
In 1995 Morton and Firth introduced the Causal Modelling Framework, which was developed into the Interactive Factors Framework by Frederickson and Cline in 2002.
The framework is applied in steps:
- Start with a focal point; one or more problem statements that require analysis
- Collect observations (factors)
- Label factors as environmental, biological, affective, behavioral, cognitive
- Identify causal relationships between factors
- Analyze
- What are the root causes?
- Are there reinforcing cycles?
- How can negative influences be mitigated?
- How can positive influences be amplified?
- Hypothesize actions that might improve the situation
- Monitor and evaluate outcomes. Refine the diagram throughout the problem-analysis cycle.
Are we seeing the whole picture?
Our analysis would benefit from applying labels to identify if there are areas we are overlooking. Often when behavioral problems present themselves they are identified in isolation. The observation is also likely to be presented by a party in direct conflict with the subject. A major advantage of following a framework like the IIF is that it assists us in rigorously seeking out additional factors related to the situation. It helps to balance our assessment by providing a checklist of perspectives to consider.
Table A: Groupings for factors
| Area | Example considerations and actions |
|---|---|
Environmental | Have there been recent changes at home or in school that may be having an impact? Would greater liaison between home and school be beneficial? Consider changes to the learning environment to meet student needs. |
Biological | Medical conditions or medication? Visual / hearing / physical impairment? Infections or illness? Hormonal changes? Diet (hunger) and sleep? Does the behavior occur at particular times such as before lunch? Consider whether a medication review, GP appointment or specialist referral would be beneficial. |
Cognitive | Approach to learning? Knowledge, skills and understanding? Concentration and attention? Thought patterns and beliefs? Is the student able to access learning? Consider whether additional learning support or intervention is required. |
Affective | Confidence and self-esteem? Are they motivation? Does the student experience anxiety? Consider whether social, emotional and mental health support may be more appropriate. |
Behavioral | Are they displaying learned responses? What might the student be trying to communicate through their behavior? Consider what function the behavior fulfills. |
It may be helpful to consider specific therapeutic interventions and support where behavior is clearly linked to social, emotional, or mental health needs.
Grouping by category
Group factors together by shift click selecting them, then pressing the (Group) button that appears. Click on the group shaded area to edit the title for the group. Drag other factors into the group as appropriate. Create groups for each of “Environmental”, “Biological”, “Cognitive”, “Affective”, and “Behavioral”.
Figure 4: Grouped by category
Stepping back we can see that perhaps we are not considering enough biological and cognitive factors in our analysis so far. Another way to interpret this is that there appear to be several affective factors, and our main hypothesis are focused on motivation. From here we are in a good position to form a plan to further investigate and influence a good outcome.
Other uses of causal analysis frameworks
Beyond being applied to individuals, the IFF can be applied to a condition such as ADHD, factors identified in a meeting such as a project retrospective, or any situation where a holistic analysis of related factors is helpful.
Conclusion
We created a pictorial representation of a case study of a student experiencing learning difficulties and social isolation. We applied the Interactive Factors Framework to label and group the types of factors and further explore possible causes.
References
Causal modeling: A structural approach to developmental psychopathology - John Morton, and Uta Frith (1995)
Educational Psychology - Tony Cline, Anthea Gulliford, and Susan Birch (2015)
Exploring the Experiences of Typically Developing Siblings who have a Brother or Sister with Autism Spectrum Condition - Kirsty Marie Underwood (2016)
Further iterations on using the Problem-analysis Framework - Michael Annan, Jocelyn Chua, Rachel Cole, Emma Kennedyd, Robert James, Ingibjörg Markúsdóttir, Jeremy Monsen, Lucy Robertson, and Sonia Shah (2013)
Special educational needs, inclusion and diversity. Second edition - Norah Frederickson and Tony Cline (2009)
Understanding and Supporting Behaviour in Schools - Dudley Educational Psychology Service (2022)