
Why Diagrams?
Diagrams are valuable
There is something magical about sketching on paper; the abstract becomes concrete, notation is crystallized, relationships emerge. Ideas jump out of the page. Clarity follows and the solution becomes clear. How many great ideas were born on the back of a napkin? How many important decisions have been influenced with a diagram? How many times has a diagram changed to world?
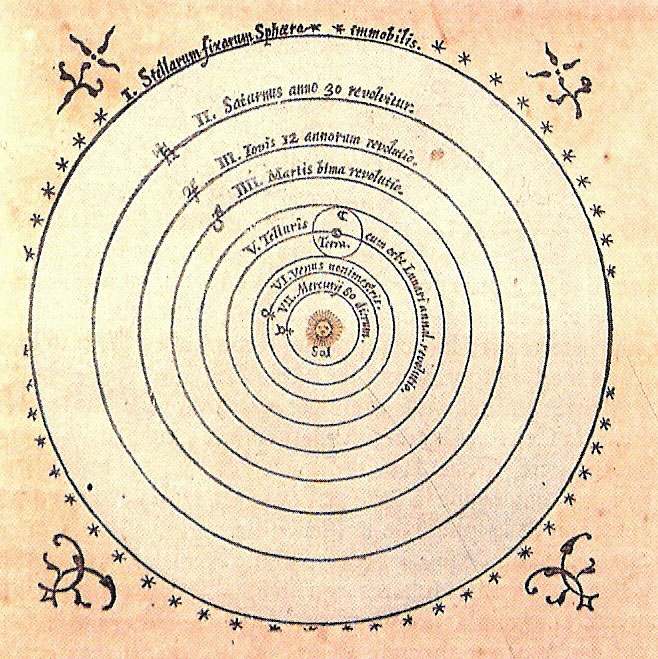
Nicolas Copernicus’s work was the defining aspect of the scientific revolution. His work stimulated further scientific investigations. He combined mathematics, physics, and cosmology to create a complete general system of the solar system. His model is essentially a diagram or circles that describes the movement of planets simply and accurately. Today our current model is basically the same as Copernicus’s original design.
Figure 1: Copernicus’ diagram of the heliocentric solar system
It’s interesting to think about why diagrams are useful for communication and problem-solving, but I’d rather take the value discussion in a different direction. I want to tell you why I personally find diagrams to have such a high value proposition.
My first experience of digital drawing was writing a computer program to render stick figures. It was mesmerizing to be able to rotate, scale and translate the figures around freely. And it led me to take up programming in earnest.
Since then, I have built pricing models, vehicle routing algorithms, optimizers, consumer facing booking systems and project management software for banks, logistics operations, hotel chains, and startups. What I learnt is that graphs are valuable. All of these systems at their heart were described as mathematical graphs (nodes and edges connecting them), leveraged with graph traversal algorithms to answer questions, optimize outcomes, and automate processes.
Corporations make big money leveraging graphs, math, and computer systems. Companies can’t afford to compete without them. Their solutions are highly specialized. Companies buy and develop software. Companies employ experts to identify and solve problems in a structured way.
Individuals rarely leverage graphs because it isn’t obvious when they are useful, how to construct them, or how to optimize them. Over time, I realized that there is a trick that helps to identify the opportunity to benefit from a graph: Sketch a diagram of what you are thinking about, draw in the relationships involved, add some labels, and now you have a graph!
To create a digital diagramming tool is to put the power of graphs into an individual’s hands. Diagrams go beyond ideation and communication, we can leverage diagrams as graphs to solve important problems, find answers, and optimize outcomes.
Paper vs digital
I want my digital diagramming experience to be as fluid as sketching on paper. Actually I want it to be even faster than that, to the point that it is noticeably faster for me to create a digital diagram than sketch one out. And the potential is there, because of the flexibility of automated layout and the speed that predefined shapes can be inserted.
I also want more than just speed, I want to be able to leverage my data. I want to pull in data from other diagrams and external databases to create a new diagram. I want to build up a reservoir of new data from those diagrams. Diagrams can be a synthesis of existing data, or the creation of new fresh data.
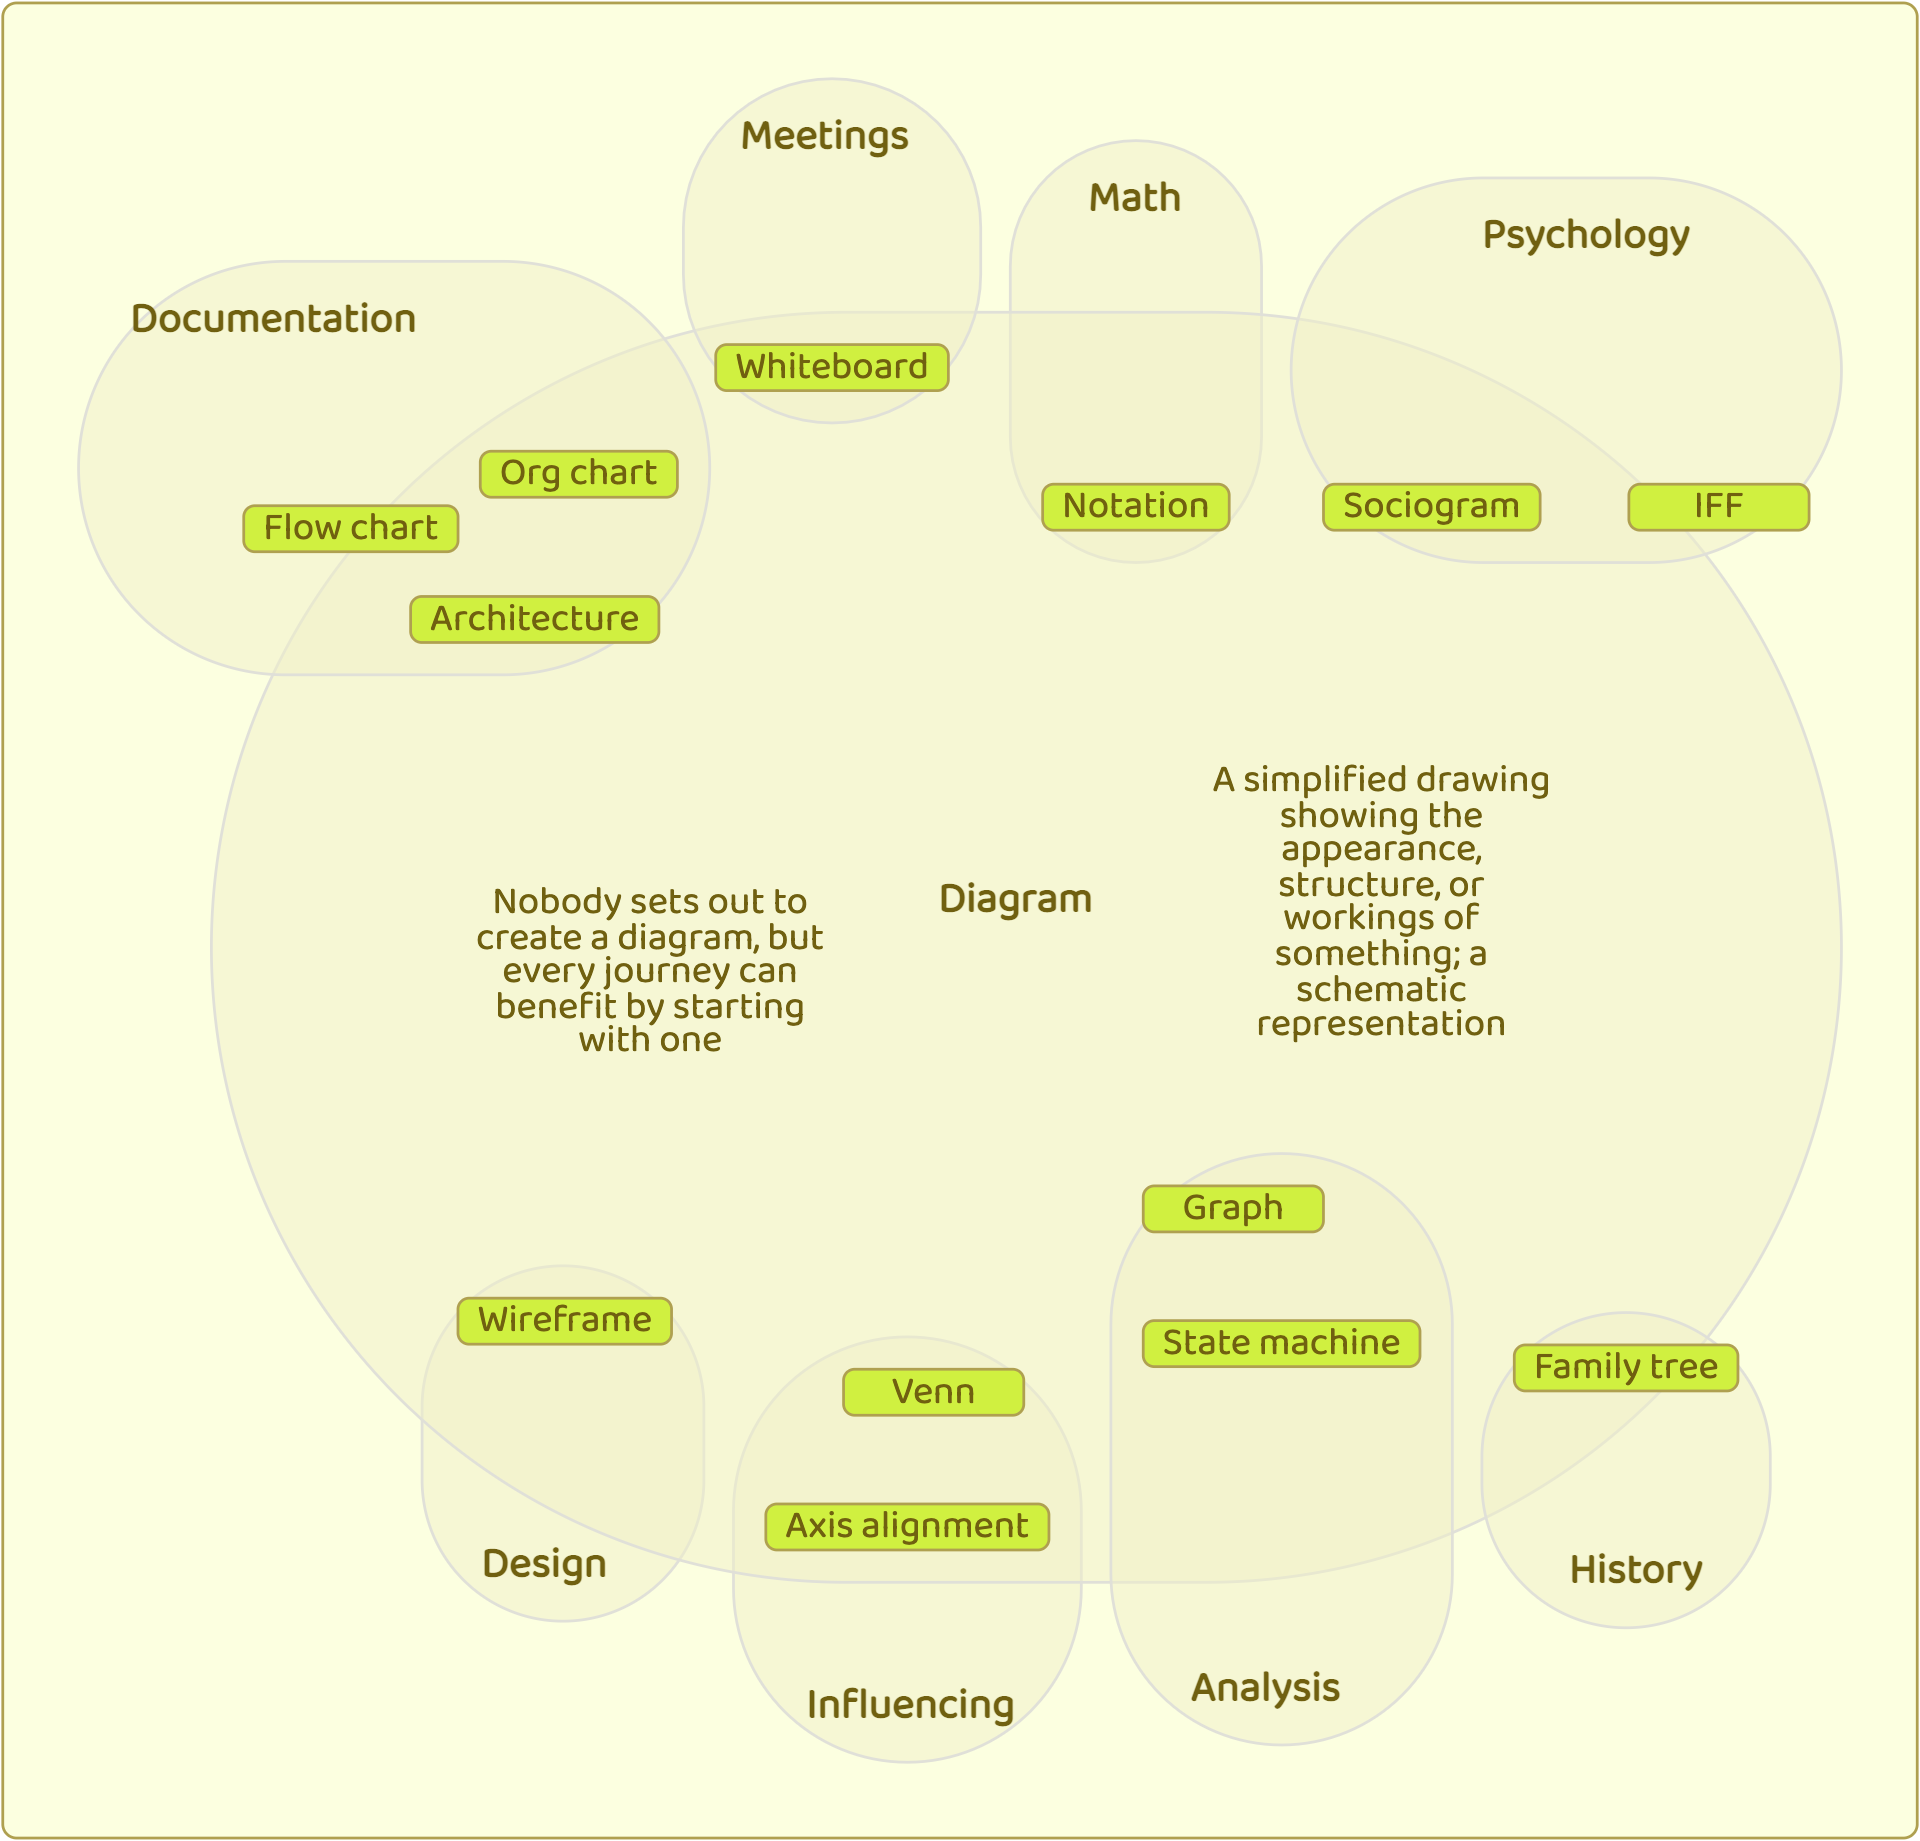
Figure 2: Venn of diagrams
Let’s do a quick review of what software is currently available.
Table 1: The best digital diagramming tools available (alphabetically)
| Product | Main features |
|---|---|
| Balsamiq | Wireframing |
| diagrams.net | Generic primitives (shapes, connections, text) |
| Figma | UI design, sharing, collaboration |
| GraphViz | Generic text based graph construction |
| Hummi | Automated layout, text input, data modelling and import |
| Mermaid | Text based with many specialized layouts |
| Miro | General brainstorming, wireframing, collaboration |
| OrgPad | General whiteboarding, presentations |
| PlantUML | Text based UML diagramming |
| tldraw | Free form diagrams, links, inovative interface, fluid |
| Visio | Flowcharts |
| Whimsical | Docs, flowcharts, wireframes, mind maps, projects, collaboration |
All of these tools are valuable tools with a loyal customer base. Some have excellent features, and work very well for specific tasks. But most of them only have a narrow scope where they really shine. Most of them wind up being insufficient and infuriating for general purpose digital diagramming:
- too tedious
- too specific
- too limited
- too complex
- too slow
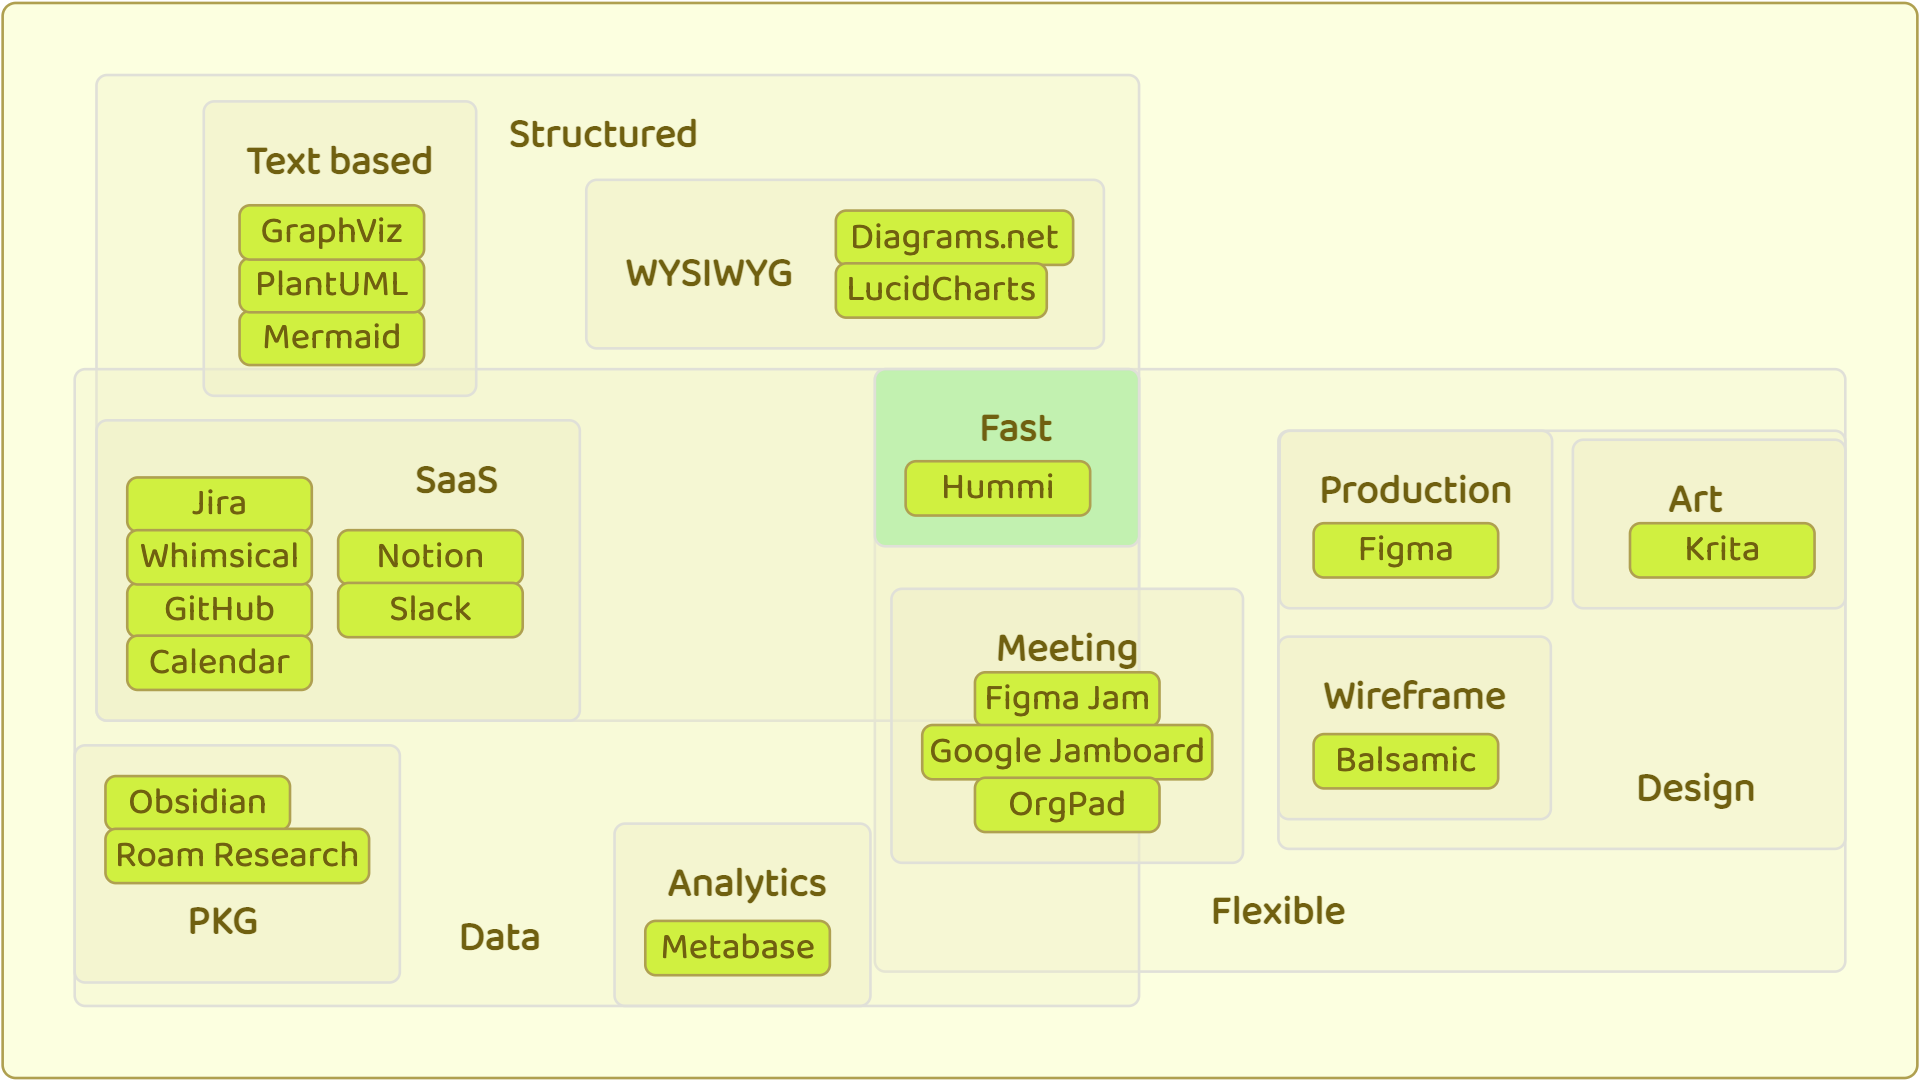
Figure 3: Diagram apps
Diagrams aren’t the only way to create a graph! There are several interesting products available to construct graphs from text.
Table 2: The best digital knowledge graph tools available (alphabetically)
| Product | Main features |
|---|---|
| Athens | Open source, web/desktop |
| Roam | Documents as graphs, addons, web/desktop/mobile |
| Logseq | Privacy first, open source, desktop |
| Obsidian | Local markdown files, desktop |
And finally a shout-out to Metabase for a compelling product for pulling in data from a bunch of sources and making senses of it all.
Why I’m building Hummi.app
I believe that creative people can solve big problems with a diagram. I believe we need a better diagramming app. An app that pushes the capabilities of digital diagramming beyond pen and paper. An app for sketch out ideas faster than I can draw it on a napkin. An app for entering data faster than I can create a spreadsheet. An app for synthesising data to feed into diagrams.
I want to go faster.